Analyze Conformations
First, necessary imports:
In [1]: from prody import *

In [2]: from numpy import *

In [3]: from pylab import *

In [4]: ion()

In [5]: import os, glob
Parse conformations
Now, let’s read initial and refined conformations:
In [6]: initial = AtomGroup('p38 initial')

In [7]: refined = AtomGroup('p38 refined')
In [8]: for pdb in glob.glob('p38_ensemble/*pdb'):
   ...:     fn = os.path.splitext(os.path.split(pdb)[1])[0]
   ...:     opt = os.path.join('p38_optimize', fn + '.coor')
   ...:     parsePDB(pdb, ag=initial)
   ...:     parsePDB(opt, ag=refined)
   ...:
---------------------------------------------------------------------------
MMCIFParseError                           Traceback (most recent call last)
<ipython-input-8-87036b051e71> in <module>()
      3     opt = os.path.join('p38_optimize', fn + '.coor')
      4     parsePDB(pdb, ag=initial)
----> 5     parsePDB(opt, ag=refined)
      6

/home/exx/ProDy-website/ProDy/prody/proteins/pdbfile.pyc in parsePDB(*pdb, **kwargs)
    125
    126     if n_pdb == 1:
--> 127         return _parsePDB(pdb[0], **kwargs)
    128     else:
    129         results = []

/home/exx/ProDy-website/ProDy/prody/proteins/pdbfile.pyc in _parsePDB(pdb, **kwargs)
    244         try:
    245             LOGGER.warn("Trying to parse as mmCIF file instead")
--> 246             return parseMMCIF(pdb, **kwargs)
    247         except KeyError:
    248             try:

/home/exx/ProDy-website/ProDy/prody/proteins/ciffile.pyc in parseMMCIF(pdb, **kwargs)
    130         kwargs['title'] = title
    131     cif = openFile(pdb, 'rt')
--> 132     result = parseMMCIFStream(cif, chain=chain, segment=segment, **kwargs)
    133     cif.close()
    134     if unite_chains:

/home/exx/ProDy-website/ProDy/prody/proteins/ciffile.pyc in parseMMCIFStream(stream, **kwargs)
    237
    238         _parseMMCIFLines(ag, lines, model, chain, subset, altloc,
--> 239                          segment, unite_chains, report)
    240
    241         if ag.numAtoms() > 0:

/home/exx/ProDy-website/ProDy/prody/proteins/ciffile.pyc in _parseMMCIFLines(atomgroup, lines, model, chain, subset, altloc_torf, segment, unite_chains, report)
    337                 stop = i
    338             else:
--> 339                 raise MMCIFParseError('mmCIF file contained no atoms.')
    340
    341         i += 1

MMCIFParseError: mmCIF file contained no atoms.
In [9]: initial
Out[9]: <AtomGroup: p38 initial (5658 atoms)>

In [10]: refined
Out[10]: <AtomGroup: p38 refined (0 atoms; no coordinates)>
Calculate RMSD change
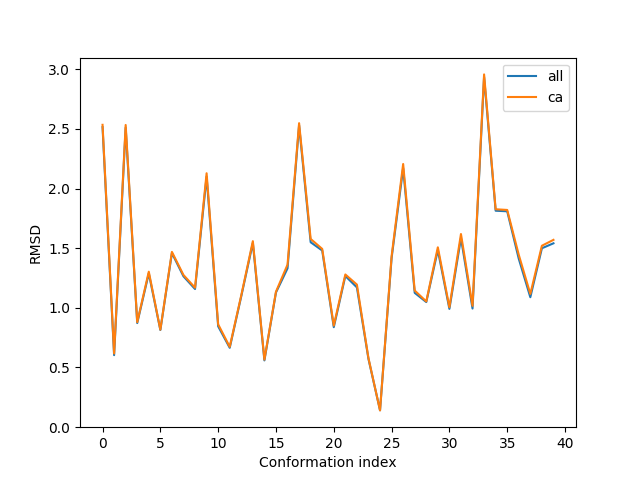
We can plot RMSD change after refinement as follows:
In [11]: rmsd_ca = []

In [12]: rmsd_all = []

In [13]: initial_ca = initial.ca

In [14]: refined_ca = refined.ca
---------------------------------------------------------------------------
AttributeError                            Traceback (most recent call last)
<ipython-input-14-40de9febca08> in <module>()
----> 1 refined_ca = refined.ca

/home/exx/ProDy-website/ProDy/prody/atomic/atomic.pyc in __getattribute__(self, name)
     98                         dummies = self.numDummies()
     99                     except AttributeError:
--> 100                         indices = self._getSubset(name)
    101                         if len(indices):
    102                             return Selection(ag, indices, selstr,

/home/exx/ProDy-website/ProDy/prody/atomic/atomgroup.pyc in _getSubset(self, label)
   1086             return self._subsets[label]
   1087         except KeyError:
-> 1088             flgs = self._getFlags(label)
   1089             try:
   1090                 return self._subsets[label]

/home/exx/ProDy-website/ProDy/prody/atomic/atomgroup.pyc in _getFlags(self, label)
   1028         except KeyError:
   1029             try:
-> 1030                 return FLAG_PLANTERS[label](self, label)
   1031             except KeyError:
   1032                 pass

/home/exx/ProDy-website/ProDy/prody/atomic/flags.pyc in setCalpha(ag, label)
    790
    791     flags = ag._getNames() == 'CA'
--> 792     indices = flags.nonzero()[0]
    793     if len(indices):
    794         torf = array([rn in AMINOACIDS for rn in ag._getResnames()[indices]])

AttributeError: 'bool' object has no attribute 'nonzero'

In [15]: for i in range(initial.numCoordsets()):
   ....:     initial.setACSIndex(i)
   ....:     refined.setACSIndex(i)
   ....:     initial_ca.setACSIndex(i)
   ....:     refined_ca.setACSIndex(i)
   ....:     rmsd_ca.append(calcRMSD(initial_ca, refined_ca))
   ....:     rmsd_all.append(calcRMSD(initial, refined))
   ....:
---------------------------------------------------------------------------
IndexError                                Traceback (most recent call last)
<ipython-input-15-71aab0f1ba84> in <module>()
      1 for i in range(initial.numCoordsets()):
      2     initial.setACSIndex(i)
----> 3     refined.setACSIndex(i)
      4     initial_ca.setACSIndex(i)
      5     refined_ca.setACSIndex(i)

/home/exx/ProDy-website/ProDy/prody/atomic/atomgroup.pyc in setACSIndex(self, index)
    858             raise TypeError('index must be an integer')
    859         if n_csets <= index or n_csets < abs(index):
--> 860             raise IndexError('coordinate set index is out of range')
    861         if index < 0:
    862             index += n_csets

IndexError: coordinate set index is out of range

In [16]: plot(rmsd_all, label='all');

In [17]: plot(rmsd_ca, label='ca');

In [18]: xlabel('Conformation index');

In [19]: ylabel('RMSD');

In [20]: legend();

Select a diverse set
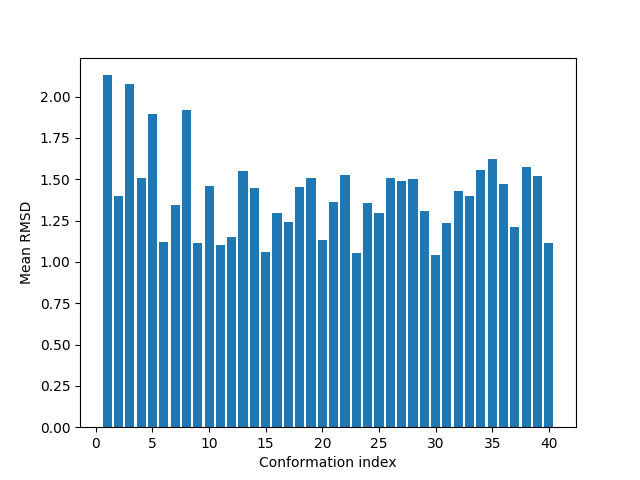
To select a diverse set of refined conformations, let’s calculate average RMSD for each conformation to all others:
In [21]: rmsd_mean = []

In [22]: for i in range(refined.numCoordsets()):
   ....:     refined.setACSIndex(i)
   ....:     alignCoordsets(refined)
   ....:     rmsd = calcRMSD(refined)
   ....:     rmsd_mean.append(rmsd.sum() / (len(rmsd) - 1))
   ....:

In [23]: bar(arange(1, len(rmsd_mean) + 1), rmsd_mean);

In [24]: xlabel('Conformation index');

In [25]: ylabel('Mean RMSD');

Let’s select conformations that are 1.2 Å away from other on average:
In [26]: selected = (array(rmsd_mean) >= 1.2).nonzero()[0]

In [27]: selected
Out[27]: array([], dtype=int64)

In [28]: selection = refined[selected]
---------------------------------------------------------------------------
IndexError                                Traceback (most recent call last)
<ipython-input-28-691a562240aa> in <module>()
----> 1 selection = refined[selected]

/home/exx/ProDy-website/ProDy/prody/atomic/atomgroup.pyc in __getitem__(self, index)
    208         elif isinstance(index, (list, np.ndarray)):
    209             unique = np.unique(index)
--> 210             if unique[0] < 0 or unique[-1] >= self._n_atoms:
    211                 raise IndexError('index out of range')
    212             return Selection(self, unique, 'index ' + rangeString(index),

IndexError: index 0 is out of bounds for axis 0 with size 0

In [29]: selection
---------------------------------------------------------------------------
NameError                                 Traceback (most recent call last)
<ipython-input-29-ae784f1d4d09> in <module>()
----> 1 selection

NameError: name 'selection' is not defined

